Why It Matters
Most SMB leadership teams only see their numbers when the month is over. This dashboard applies my accounting background to give owners a real-time command center covering profitability, liquidity, leverage, and runway in a single view.
Solution Overview
- Mock but realistic data model generated in Python (Pandas/NumPy) to mirror P&L, balance sheet, and cash flow statements.
- SQL layer (PostgreSQL) that standardizes chart of accounts and stores calculated ratios.
- Python analytics to compute advanced metrics such as cash conversion cycle, return on invested capital, and debt servicing ability.
- Power BI experience with drill-through narratives, KPI scorecards, and proactive variance alerts.
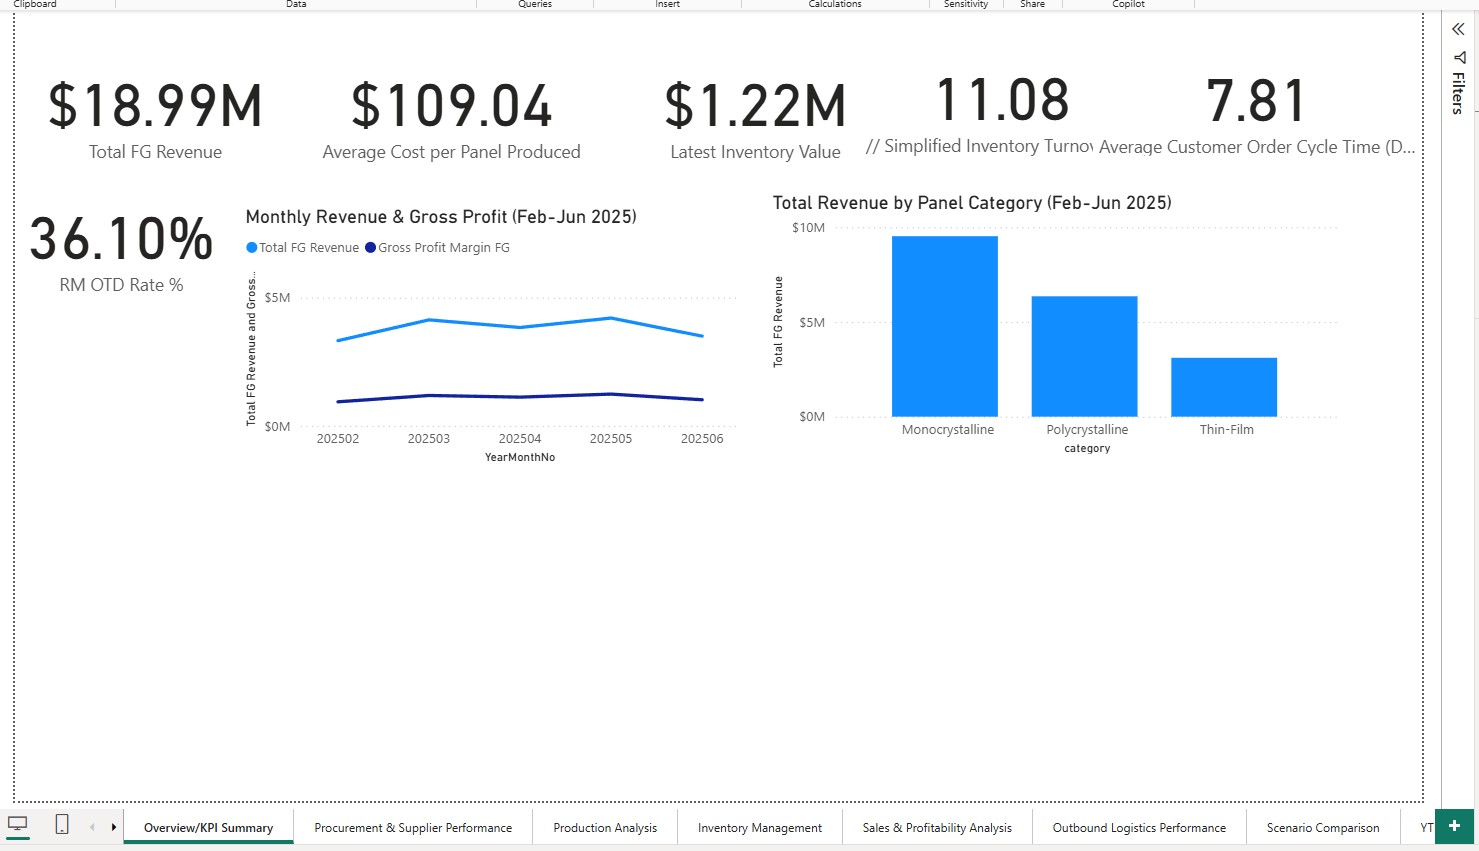
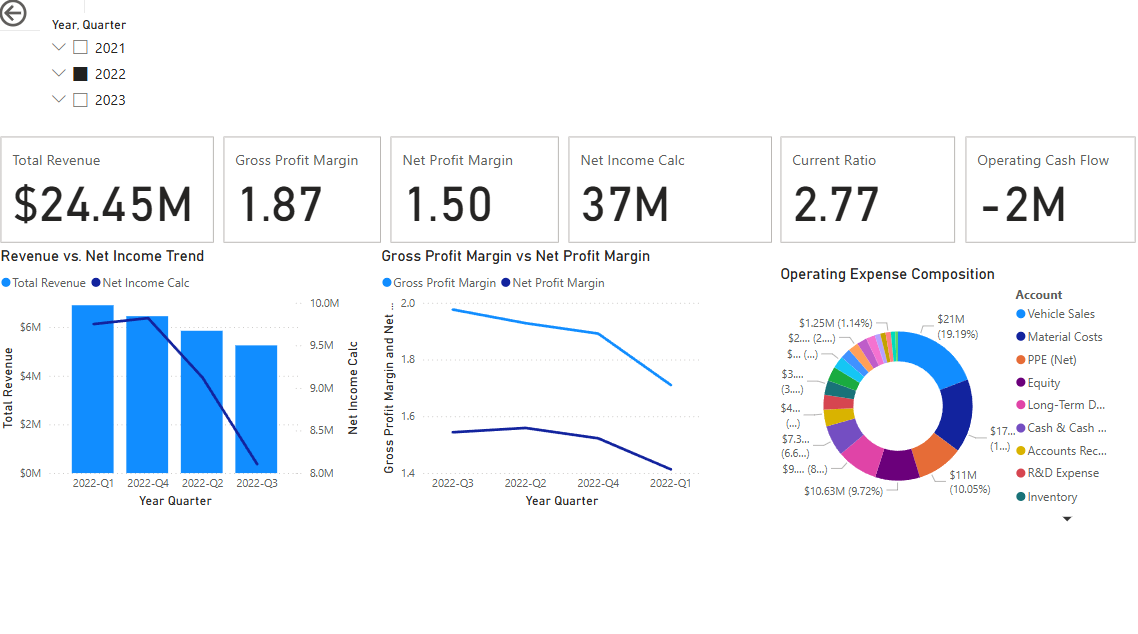
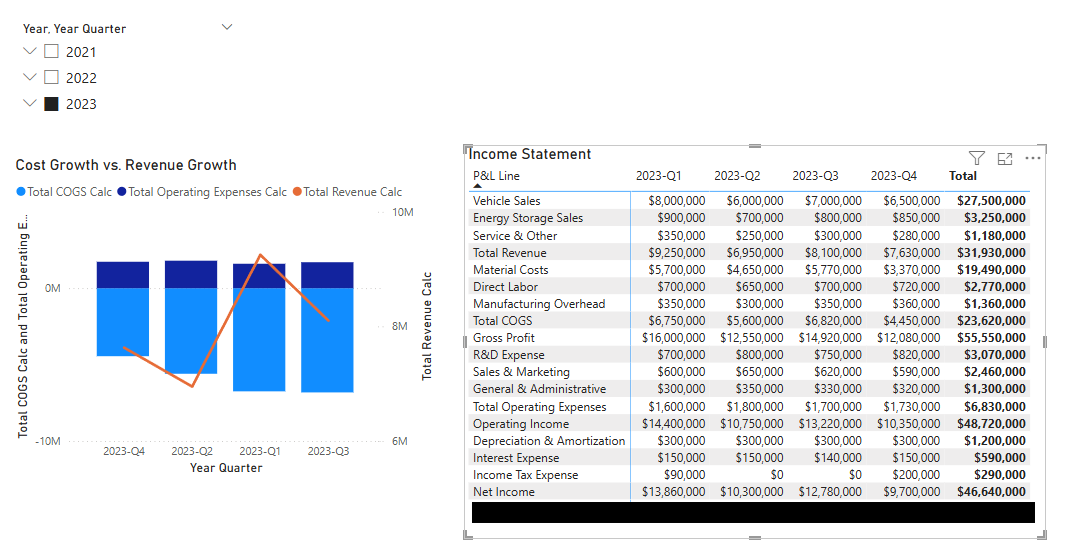
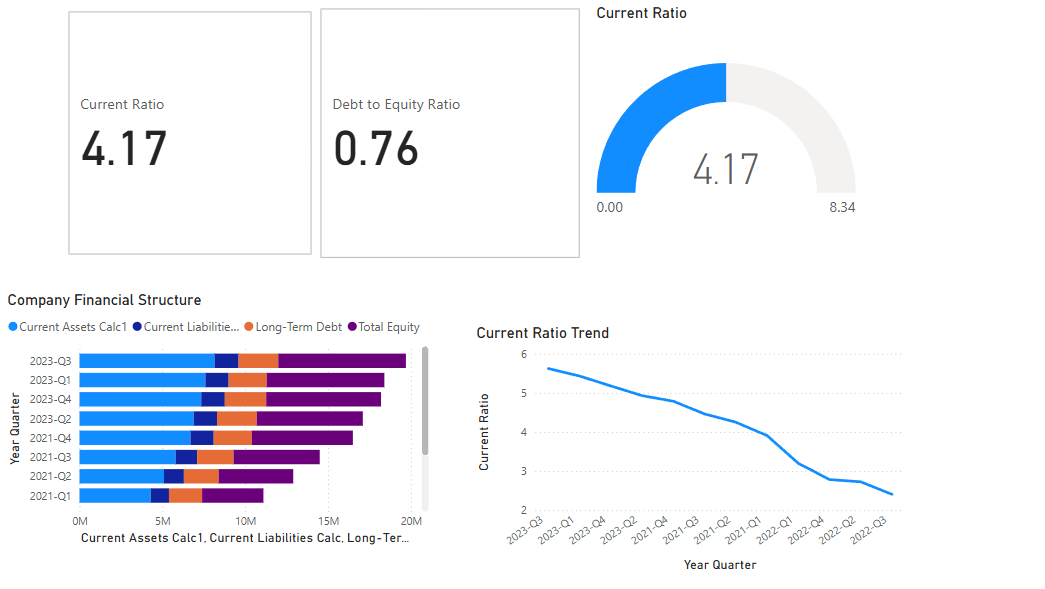
What Stakeholders See
- Executive summary with trending KPIs, variance explanations, and “focus this week” cards.
- Deep dives for P&L, balance sheet, and cash flow with visual ratio tracking.
- Scenario toggles that highlight the impact of pricing, expense, or headcount changes on cash runway.
Highlights
- Automated data refresh: scheduled Python + SQL job rebuilds the model daily.
- Narrative annotations: BI tiles include contextual notes generated from Python calculations to highlight significant moves.
- Role-based layout: executives see high-level KPIs while finance teams can open supporting schedules directly in the dashboard.
Applicable Beyond SMB Finance
The same architecture powers portfolio monitoring, nonprofit stewardship, or any organization that needs near-real-time cash visibility. Swap in your data model and KPIs—the automation, data quality, and UX patterns stay the same.
Gallery