Why It Matters
Supply chain costs hide inside dozens of disconnected spreadsheets. This analyzer recreates a full manufacturing/retail network, then uses Python, SQL, and Power BI to show where cash is leaking—and how to get it back.
Solution Overview
- Data architecture: PostgreSQL warehouse with mock but realistic procurement, supplier scorecards, inventory levels, logistics expenses, and cycle times.
- Python analytics: Pandas/NumPy models compute cost-to-serve, inventory turnover, supplier reliability, and “what-if” simulations.
- Scenario engine: users can test alternate sourcing strategies, transportation modes, or reorder points and instantly see the financial impact.
- Power BI dashboard: advanced DAX drives KPI tiles, waterfall breakdowns, and scenario comparisons for executives and operations managers.
What Stakeholders See
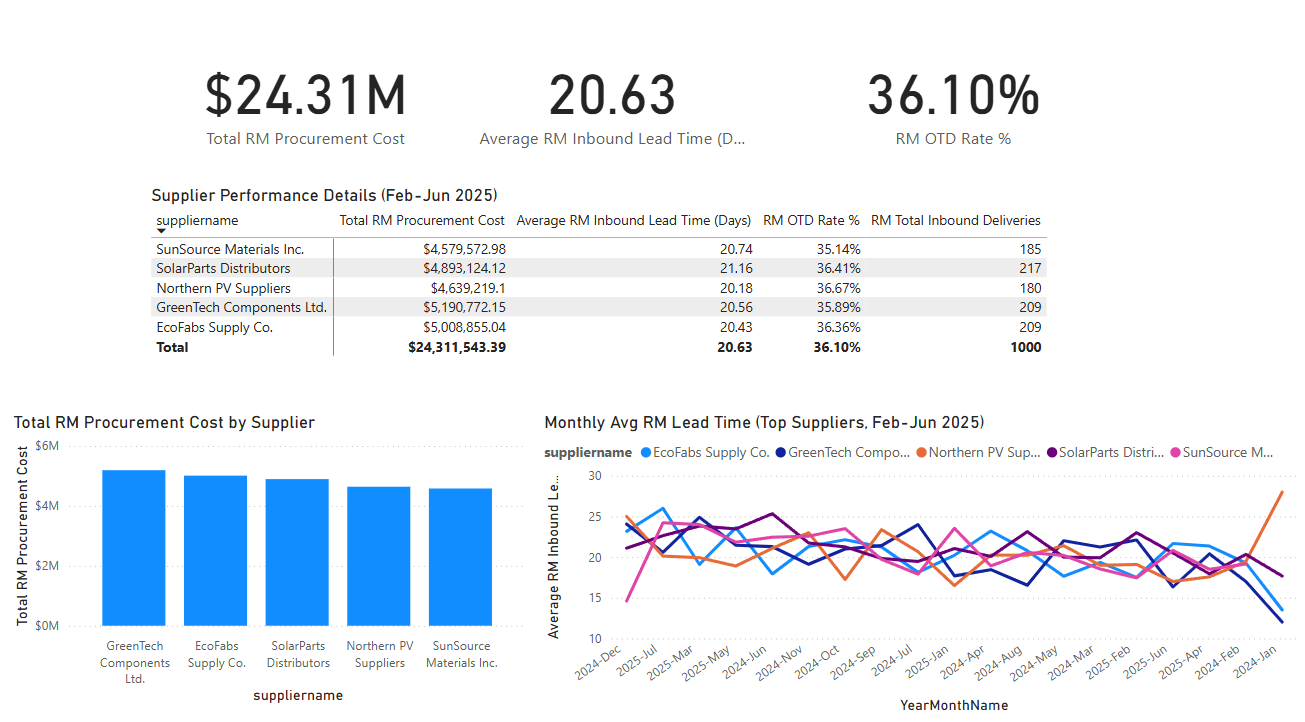
- Procurement health view with supplier scorecards and contract renewal alerts.
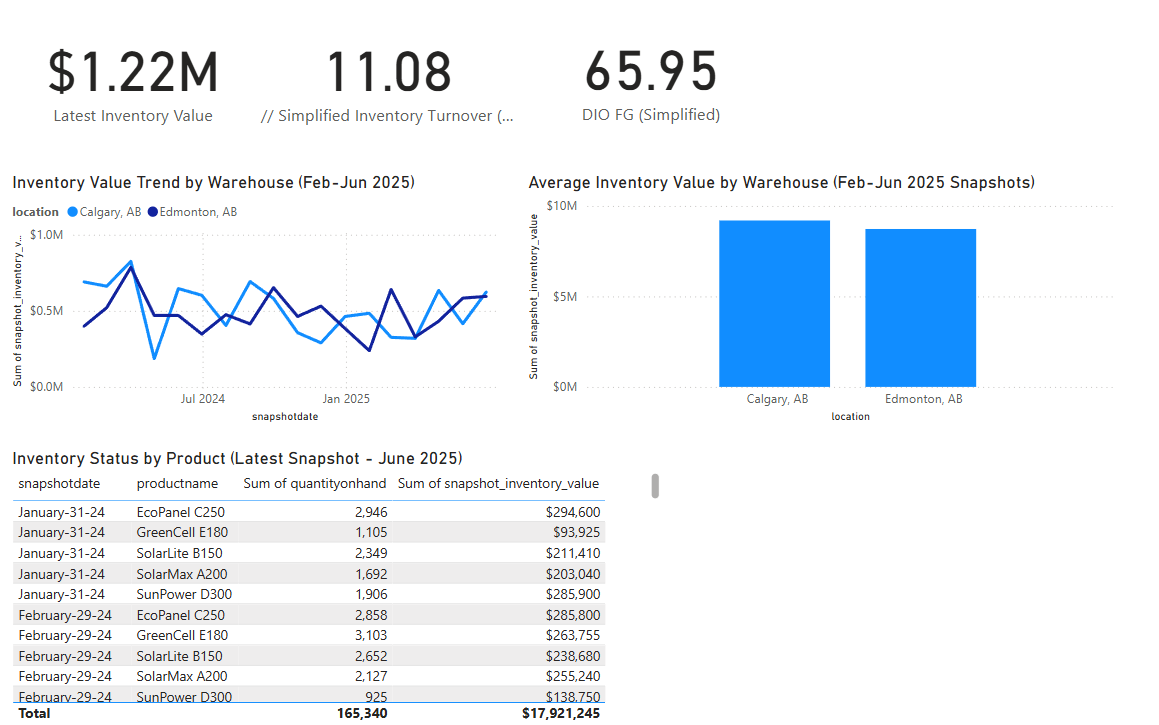
- Inventory command center showing safety stock, days of supply, and working-capital impact.
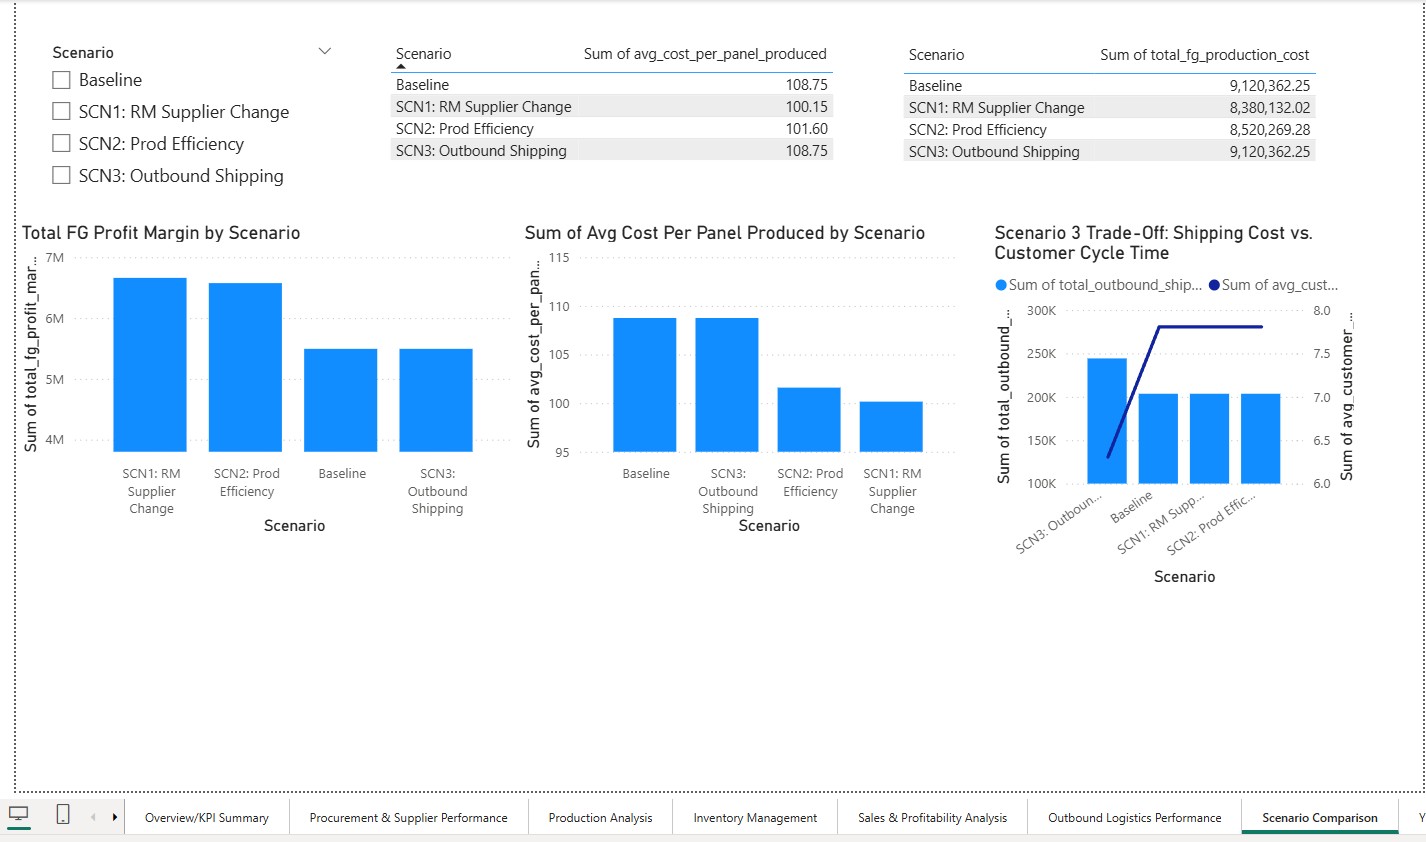
- Scenario board that compares current spend with optimized recommendations from the Python simulations.
Highlights
- End-to-end traceability from source data to visualization.
- Operational + financial lens so both COOs and CFOs see the same picture.
- Narrated insights embedded in tooltips to explain the “why” behind each recommendation.
Applicable Beyond Supply Chains
Swap procurement data for marketing spend, field operations, or professional services utilization—the modeling approach (Python + SQL + BI) remains identical. This analyzer simply demonstrates how the toolkit scales to any cost center.
Gallery